

A log is often seen as a line of text: a flat object, sometimes enriched, but still very close to a table. Yet while we read events in terminals, SIEMs and investigation tools, attackers move through a much more relational space.
They move from an account to a machine, from a machine to a secret, from a secret to a privilege, and from that privilege to an objective. This article suggests a change of mental model: thinking about some cyber data as graphs, not only as lists of events.
This is the first article in a series. It introduces the concepts; the next ones will go deeper into implementation and concrete examples.
Result obtained from Zeek logs.
The graph as an attack model
As defenders, we often reason in terms of attack surface, network topology, vulnerabilities and detection rules. That is necessary, but it does not always describe how an attacker builds their path.
For an attacker, one action opens another. A compromise gives access to context. That context reveals new possible paths. Some paths fail, others expose new opportunities. In other words, even if they do not phrase it this way, attackers often think in graphs.
What is a graph?
A graph is a data structure made of nodes and edges connecting those nodes. The definition is simple, but the applications are broad.
A subway map is a graph: each station is a node, and each line between stations is an edge. In cybersecurity, a node can represent a machine, a user, an IP address, a Kerberos ticket, a process or a file. An edge represents a relationship: a network connection, an authentication, a process execution, access to a share or a privilege delegation.
What makes graphs powerful is their ability to represent paths. We no longer ask only what an object is, but how it lets us move from one state to another.
In this context, the most useful graphs are often directed and sometimes weighted. A directed edge has a direction: A connects to B, a process launches another process, a user authenticates to a machine. A weighted edge carries a value: frequency, risk, cost, confidence, criticality or probability.
Example: phishing compromise
Imagine a cybercrime group at the beginning of an attack. Each node represents a possible action for GM, our “Grand Villain”. The red nodes represent steps already completed.
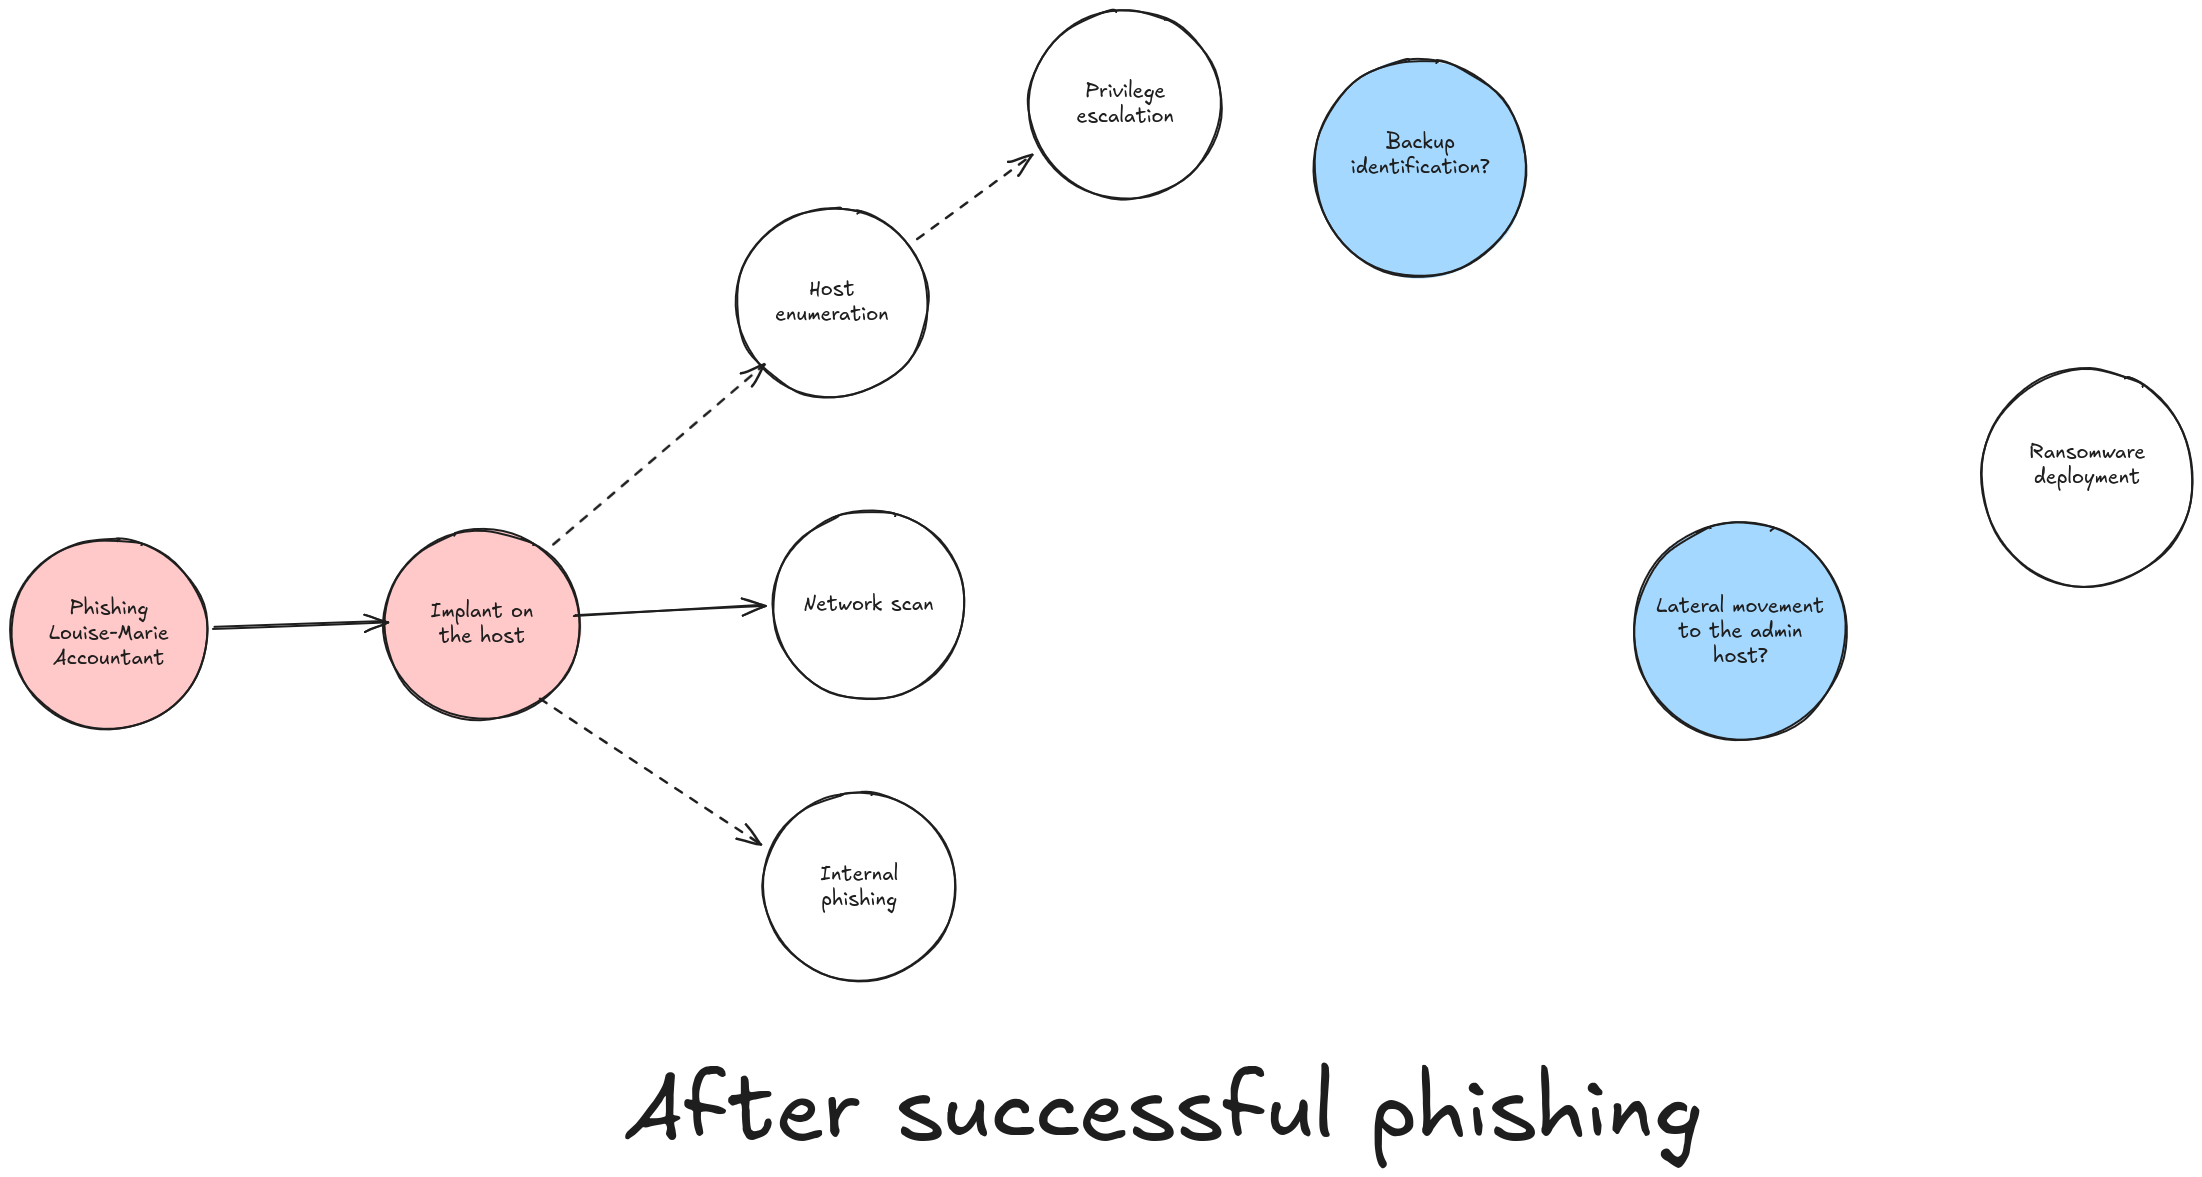
GM has compromised the workstation of Louise-Marie, an accountant in a software development company. At this stage, he only has a partial idea of what could lead him to ransomware deployment.
Some steps will fail. Others will reveal new possibilities. If he decides to scan the local network around the compromised host, the graph changes:
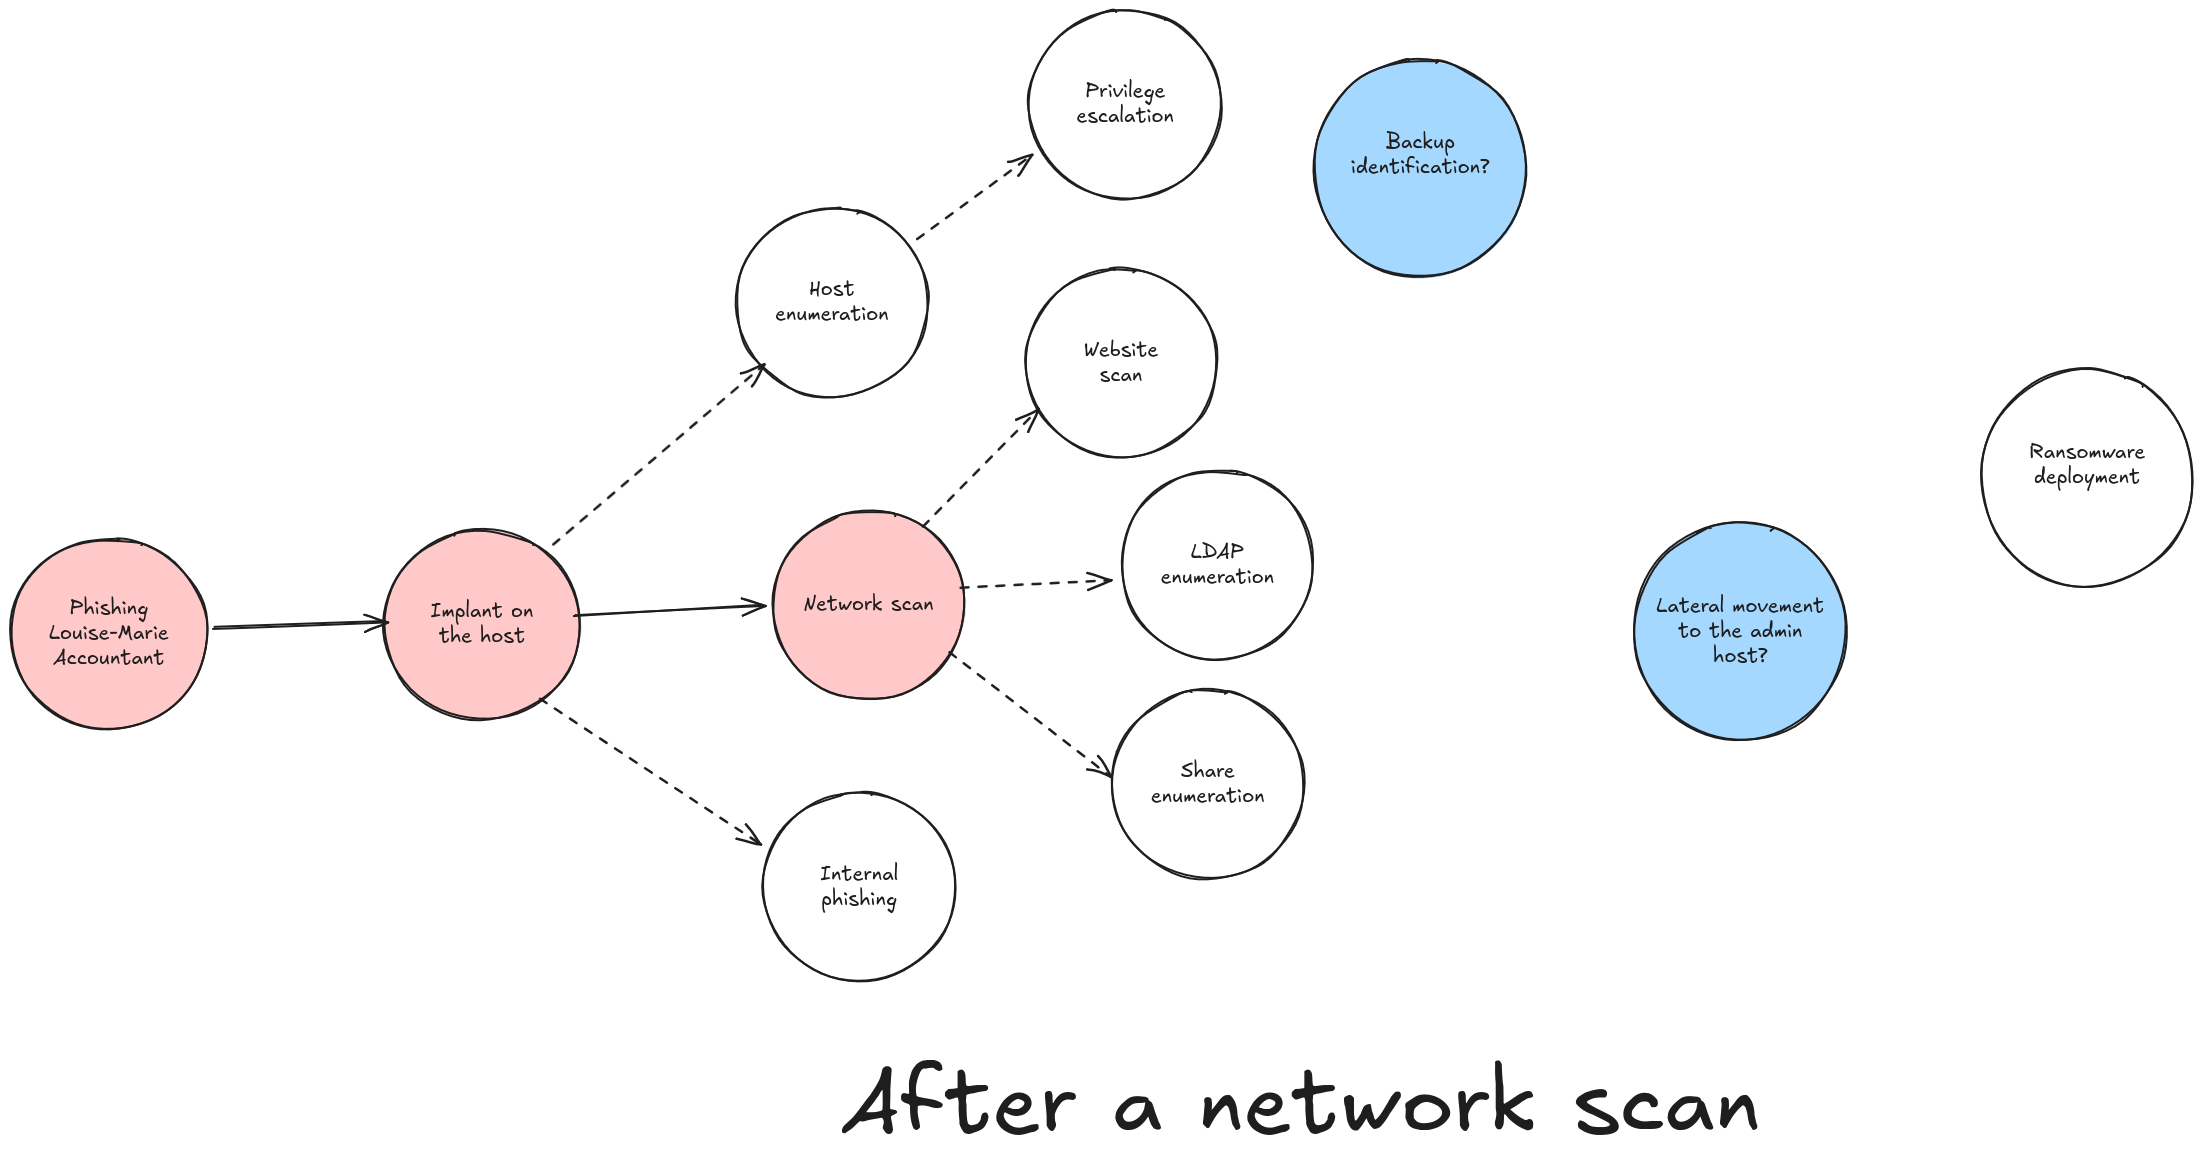
The scan is not just an isolated event. It changes the space of possibilities. It adds nodes, relationships, paths, and therefore new decisions for the attacker.
The BloodHound example
BloodHound is one of the best-known examples of graph thinking applied to offensive security. It models a Microsoft Active Directory environment as relationships, then searches for paths to sensitive objectives.
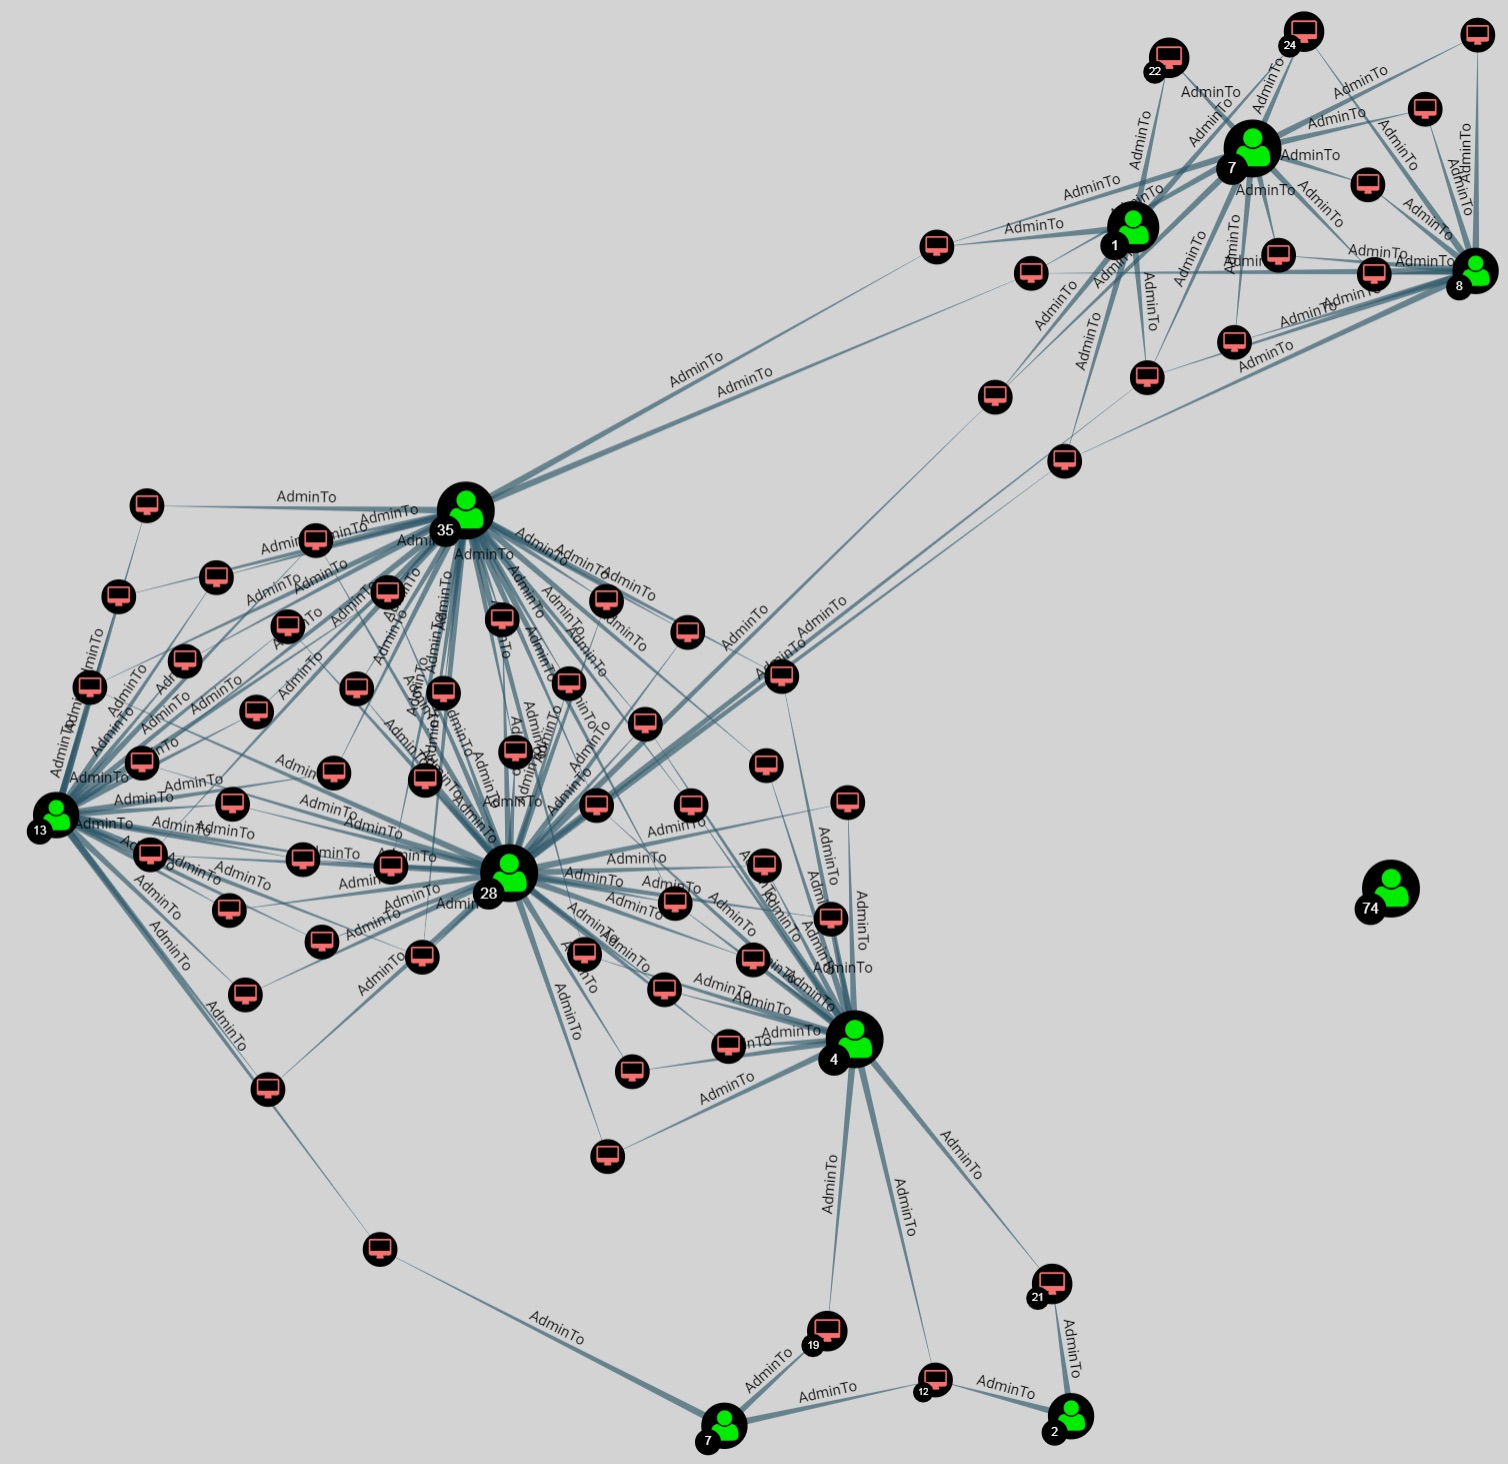
The strength of this approach is that it does not only look at objects individually. It looks for exploitable paths: who can access what, through which relationship, with which privilege level, and in how many steps.
Graph thinking for defenders
For defenders, modeling possible attacker progression inside an information system can help with several goals:
- identifying sensitive points to harden;
- placing monitoring at strategic locations;
- understanding and containing an attacker during incident response;
- prioritizing hardening actions according to their real impact on attack paths.
Imagine a graph able to represent feared actions in an information system and their possible transitions.
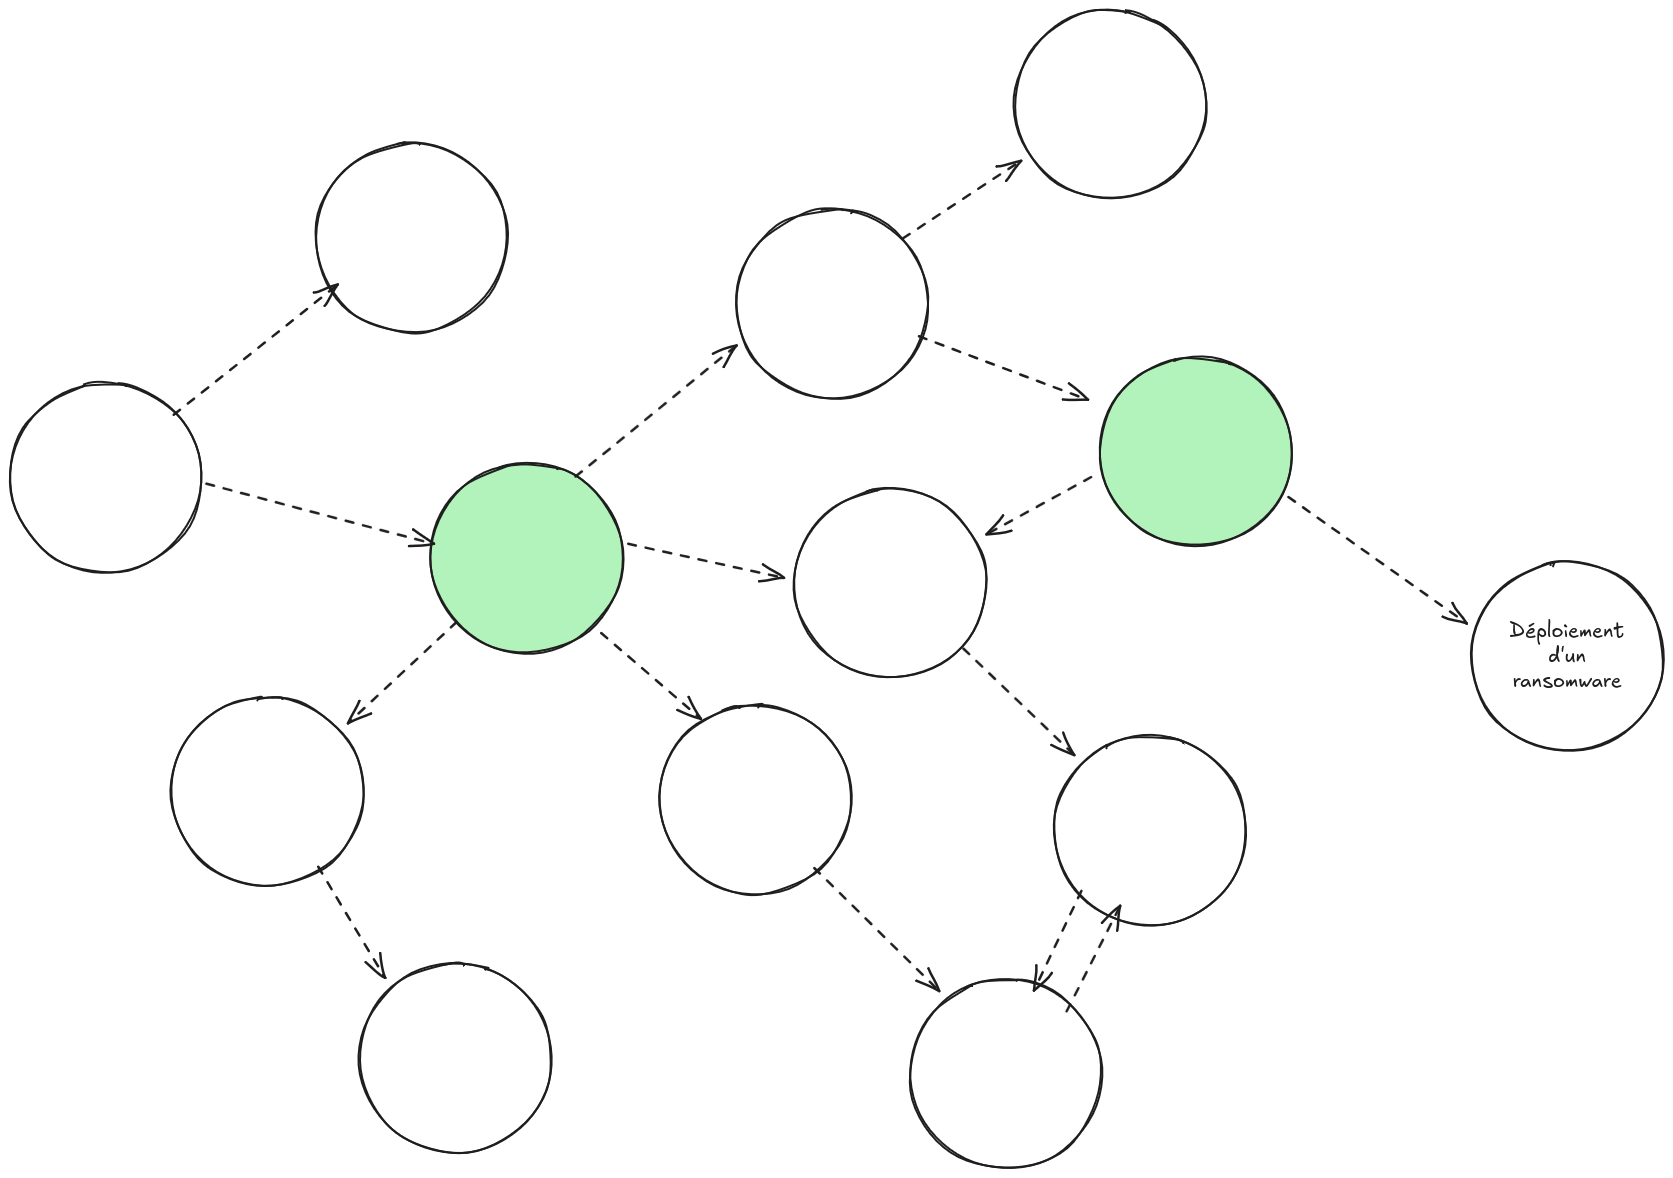
In this graph, the green nodes represent bottlenecks. They become privileged points of attention: if many paths go through them, then monitoring, hardening or segmenting them can have a disproportionate impact on global security.
Applying graphs to DFIR
In DFIR, we often start from an incident and pivot through available data to understand where the attacker went, what they did and what they may have reached.
Pivoting is one of the analyst’s core gestures. It means identifying an interesting marker, then changing perspective to use it as a new entry point. An IP leads to a domain, a domain to a certificate, a certificate to a JA3S, a JA3S to other servers, and so on.
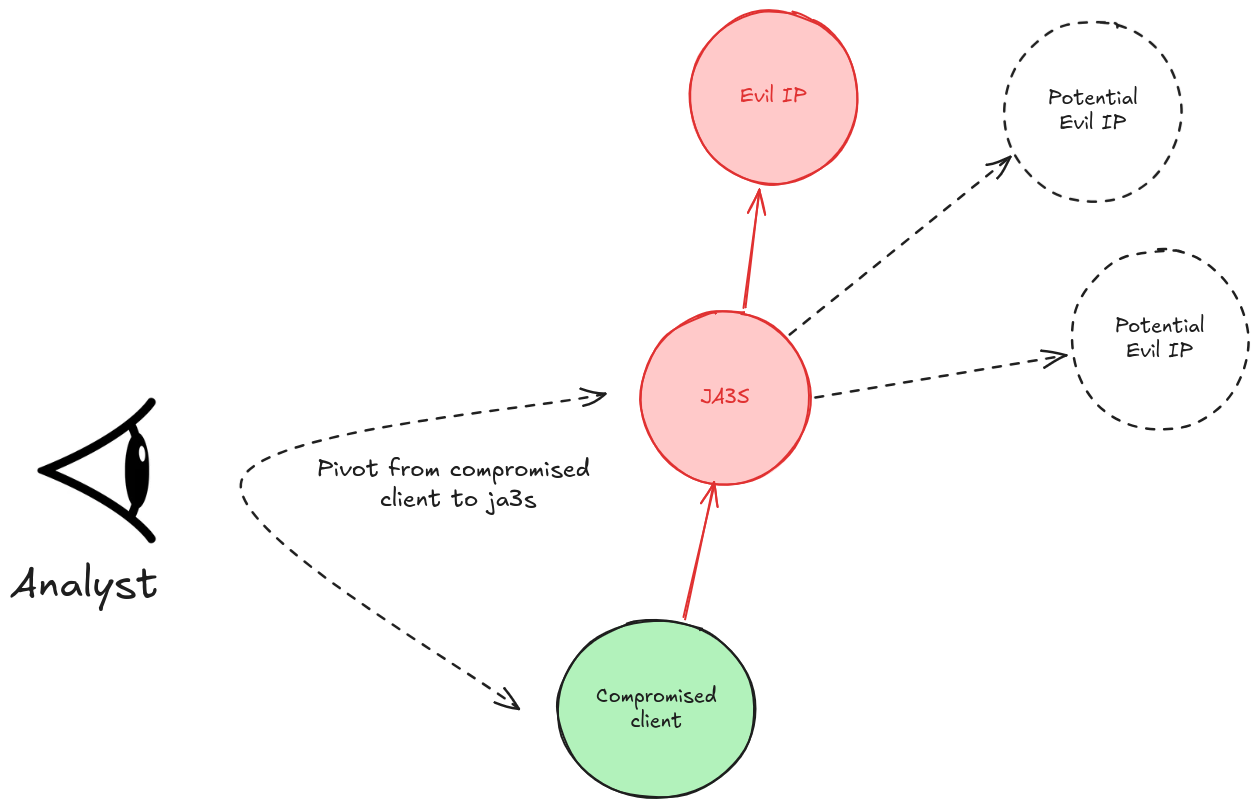
In this example, the analyst identifies a new marker: the JA3S associated with a malicious server. Pivoting on that JA3S can reveal other servers sharing the same TLS fingerprint.
In a classic SIEM
In ELK, the analysis could look like this. We start by searching for connections to a known command and control server:
FROM logs-zeek.ssl-*
| WHERE destination.ip == "185.234.X.X"
| KEEP source.ip, destination.ip, tls.server.ja3s, @timestamp
| SORT @timestamp DESC
We then retrieve the JA3S: d41d8cd98f00b204e9800998ecf8427e, and pivot:
FROM logs-zeek.ssl-*
| WHERE tls.server.ja3s == "d41d8cd98f00b204e9800998ecf8427e"
    AND destination.ip != "185.234.X.X"
| STATS connections = COUNT(*),
        first_seen = MIN(@timestamp),
        sources = VALUES(source.ip)
    BY destination.ip
| SORT connexions DESC
This works, but it forces the analyst to mentally rebuild relationships. A graph makes those transitions explicit.
In a graph tool
In a graph-oriented tool, the same pivot can become a natural interface action.
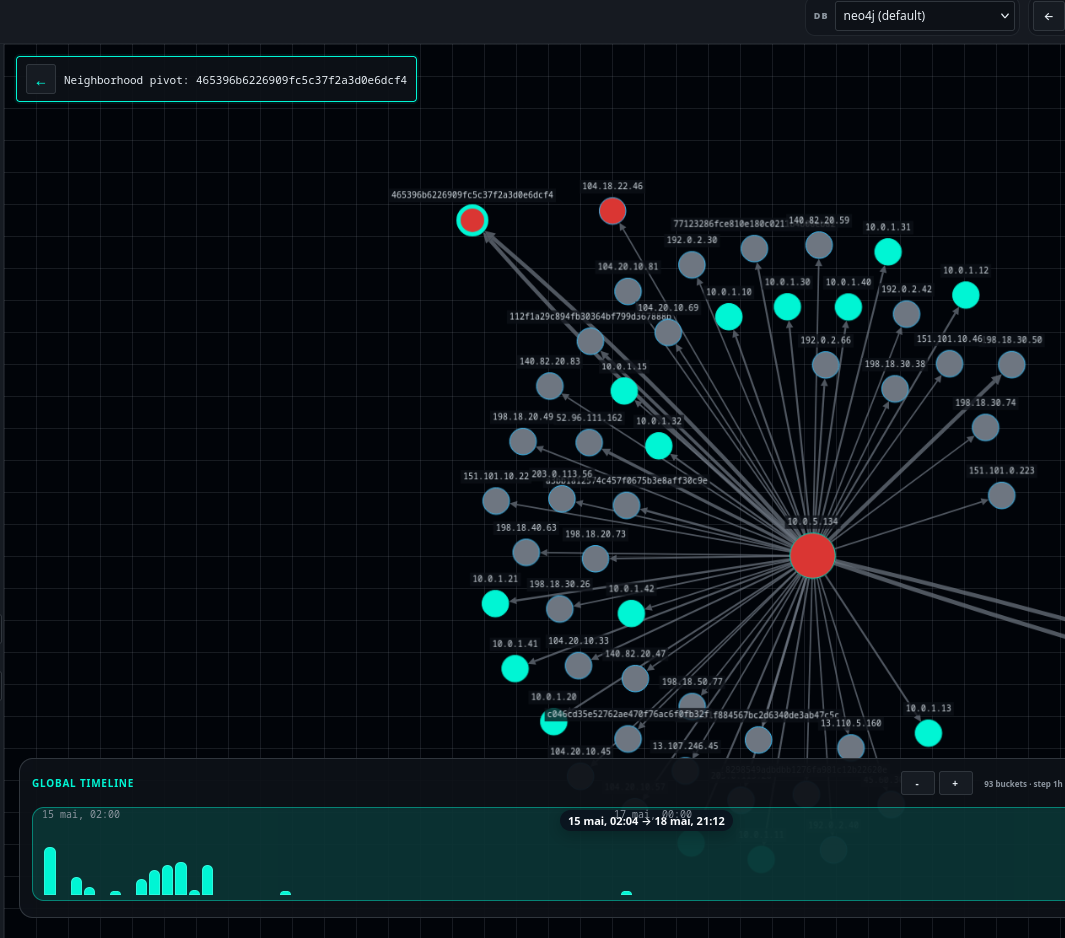
Here, pivoting on the JA3 465396b6226909fc5c37f2a3d0e6dcf4 could be done with a right click. Coloring nodes identified as suspicious could follow the same principle.
The benefit is not only visual. The analyst manipulates relationships directly instead of rebuilding them query after query.
Toward multidimensional analysis
If we could move more cyber data into a graph database, analysis could become smoother across several dimensions.
Connecting CTI and investigation
It is often difficult to connect investigation data with OSINT or CTI. Today, when an analyst finds a suspicious IP, they may open VirusTotal in one tab, Shodan in another, then manually correlate the results with their logs.
If everything were represented in the same graph, with shared nodes such as IPs, domains, hashes, JA3 or JA3S fingerprints, pivoting between investigation and threat intelligence would become more natural. An IP observed in logs could immediately appear as linked to a report, malware family, infrastructure or campaign.
Detecting structural anomalies
Classic machine learning approaches often work on feature vectors. That is useful, but some suspicious behaviors only make sense inside a relational structure.
An account bouncing from machine to machine outside its normal habits, a host suddenly scanning its neighborhood, a process initiating new connections: these behaviors draw shapes.
Algorithms designed for graphs, such as Graph Neural Networks (GNNs), could help detect these structural anomalies without writing every case as a manual rule.
Correlating host and network data
A network connection without host context remains partial information. By enriching a graph with Windows events such as Event ID 4624 and Sysmon events such as Event ID 3, we could answer questions that are difficult in a classic SIEM:
- which process initiated this connection to a C2?
- which account was authenticated on the machine at that time?
- was this lateral movement preceded by suspicious authentication?
- is this server linked to other observables already seen in the investigation?
Correlation that sometimes requires hours of queries could become a graph traversal.
In practice
To explore the transformation of network data into graphs, I am currently working on a project named JACG (Just a Cyber Graph), based on Neo4j: https://github.com/theophane-droid/jacg.
Two screenshots shown in this article come from early experiments around this project. Future articles will detail the implementation, the data model and the practical use of the tool.
Conclusion
A graph is not a magic solution. The main difficulty is still preparing the data, normalizing it, and fitting it into a useful model.
But the shift in perspective is powerful: instead of seeing only events, we can see relationships, paths and chokepoints. For defense, threat hunting and DFIR, that depth can save time and reveal links that are otherwise hard to perceive.
See you in the next part, where we will transform Zeek logs into a graph.