The ability to conduct forensic operations at scale is often a challenge. The traditional approach consists of loading a disk image into a tool such as The Sleuth Kit or Plaso and using the tool’s interface to analyse a single evidence file. That works fine, but what about 50 machines? 200? Or even just 10 when you are working alone?
Just as a SOC must feed all logs into its SIEM, forensic operators need to centralise all data into a tool that lets them run searches, build dashboards, and so on.
Dissect addresses this problem by providing a framework for extracting forensic artefacts from evidence files. It supports Windows, Linux, and macOS artefacts across a wide variety of input formats. In simple terms, it takes what Dissect calls containers (a broad range of data formats) and extracts the specific artefacts you want to analyse, such as evtx files. This brings a significant performance advantage: you can target a single artefact type, unlike tools such as Plaso which process every available artefact.
Dissect Setup
To install Dissect we will use pipx, which installs Python-based tools and isolates them in their own virtual environments.
sudo apt update
sudo apt install -y pipx
pipx ensurepath
source ~/.bashrc
Then:
pipx install dissect
Parsing Data
To extract data from an evidence file with Dissect, we use the target-query command. Dissect automatically detects the disk format (raw, ova, qcow, etc.) and extracts artefacts based on the function you specify. The following example extracts Windows event logs:
target-query E01-DC01/20200918_0347_CDrive.E01 -f evtx
This command can be combined with rdump, which reads and writes Dissect records in various formats. For example, you can output records as JSON, send them to Splunk, or push them directly to Elasticsearch.
Deploying ELK
To set up ELK we will use a Docker-based project that handles the full stack installation, giving us Elasticsearch, Kibana, and Logstash with minimal effort.
git clone https://github.com/deviantony/docker-elk
Edit setup/roles/logstash_writer.json to extend Logstash permissions to all indices:
...
  "indices": [
    {
      "names": [
        "*"
      ],
...
Before starting the stack, make sure to update the default passwords in the .env file at the root of the project. Replace every changeme with a strong password: openssl rand -base64 32.
Then start the stack in this order to ensure the configuration is applied correctly:
docker compose up kibana-genkeys
docker compose up setup
docker compose up -d
Configuring ELK
We will start by adding an index template for our Dissect indices. This template raises the field limit from the default 1000 (which many Dissect events exceed) and defines the date field mappings.
{
  "index_patterns": ["dissect-*"],
  "template": {
    "settings": {
      "index.mapping.total_fields.limit": 3000,
      "index.mapping.total_fields.ignore_dynamic_beyond_limit": true
    },
    "mappings": {
      "properties": {
        "@timestamp": { "type": "date" },
        "ts": { "type": "date" }
      }
    }
  },
  "priority": 200
}
Apply it via the Elasticsearch API:
source .env
curl -u elastic:${ELASTIC_PASSWORD} \
  -H "Content-Type: application/json" \
  -X PUT http://localhost:9200/_index_template/dissect-template \
  --data-binary @template-dissect.json
Next, configure the Logstash pipeline. It will listen on port 50000 for incoming events. Create the file logstash/pipeline/dissect.conf:
input {
  tcp {
    port => 50000
    mode => "server"
    codec => json_lines
    ecs_compatibility => "v8"
    dns_reverse_lookup_enabled => false
  }
}
filter {
  mutate {
    remove_field => [ "_version" ]
  }

  if [ts] {
    date {
      match => [ "ts", "ISO8601" ]
      target => "@timestamp"
    }
  }

  if [_classification] {
    mutate {
      copy => { "_classification" => "[event][dataset]" }
    }
  } else {
    mutate {
      add_field => { "[event][dataset]" => "dissect.data" }
    }
  }

  if [_source] {
    mutate {
      copy => { "_source" => "[event][module]" }
    }
  } else {
    mutate {
      add_field => { "[event][module]" => "dissect" }
    }
  }

  mutate {
    add_field => { "ingest_source" => "tcp" }
    remove_field => [ "_source", "_classification" ]
  }
}

output {
  elasticsearch {
    hosts => ["http://elasticsearch:9200"]
    user => "logstash_internal"
    password => "${LOGSTASH_INTERNAL_PASSWORD}"
    index => "dissect-%{[event][dataset]}-%{+YYYY.MM.dd}"
  }
}
Also remove the default Logstash configuration file:
rm logstash/pipeline/logstash.conf
Ingestion
The following command will:
- extract evtx records from the disk image
- format them as JSON with additional metadata fields
- send them to the port 50000 we opened earlier
target-query file.E01 -f evtx -q \
  | rdump \
      -J \
      --record-classification evtx \
      -X _version \
  | nc -N logstash 50000
That’s it - sit back and wait for the data to be indexed.
You can monitor the ingestion process at any time with
docker logs docker-elk-logstash-1 -f
First Searches
Open Kibana at http://yourip:5601. If you have not changed the credentials in .env, the defaults are elastic:changeme. Navigate to Analytics > Discover to access the search interface.
Click Try ES|QL to use this query language, which is close in spirit to Splunk’s SPL and very powerful. Here is an example query:
FROM dissect-dissect.data-*
  | WHERE EventID == 4624
  | STATS hosts = VALUES(hostname), providers = VALUES(Provider_Name),
      subjects = VALUES(SubjectUserName), targets = VALUES(TargetUserName),
      count = COUNT(*)
        BY LogonType
  | SORT count DESC
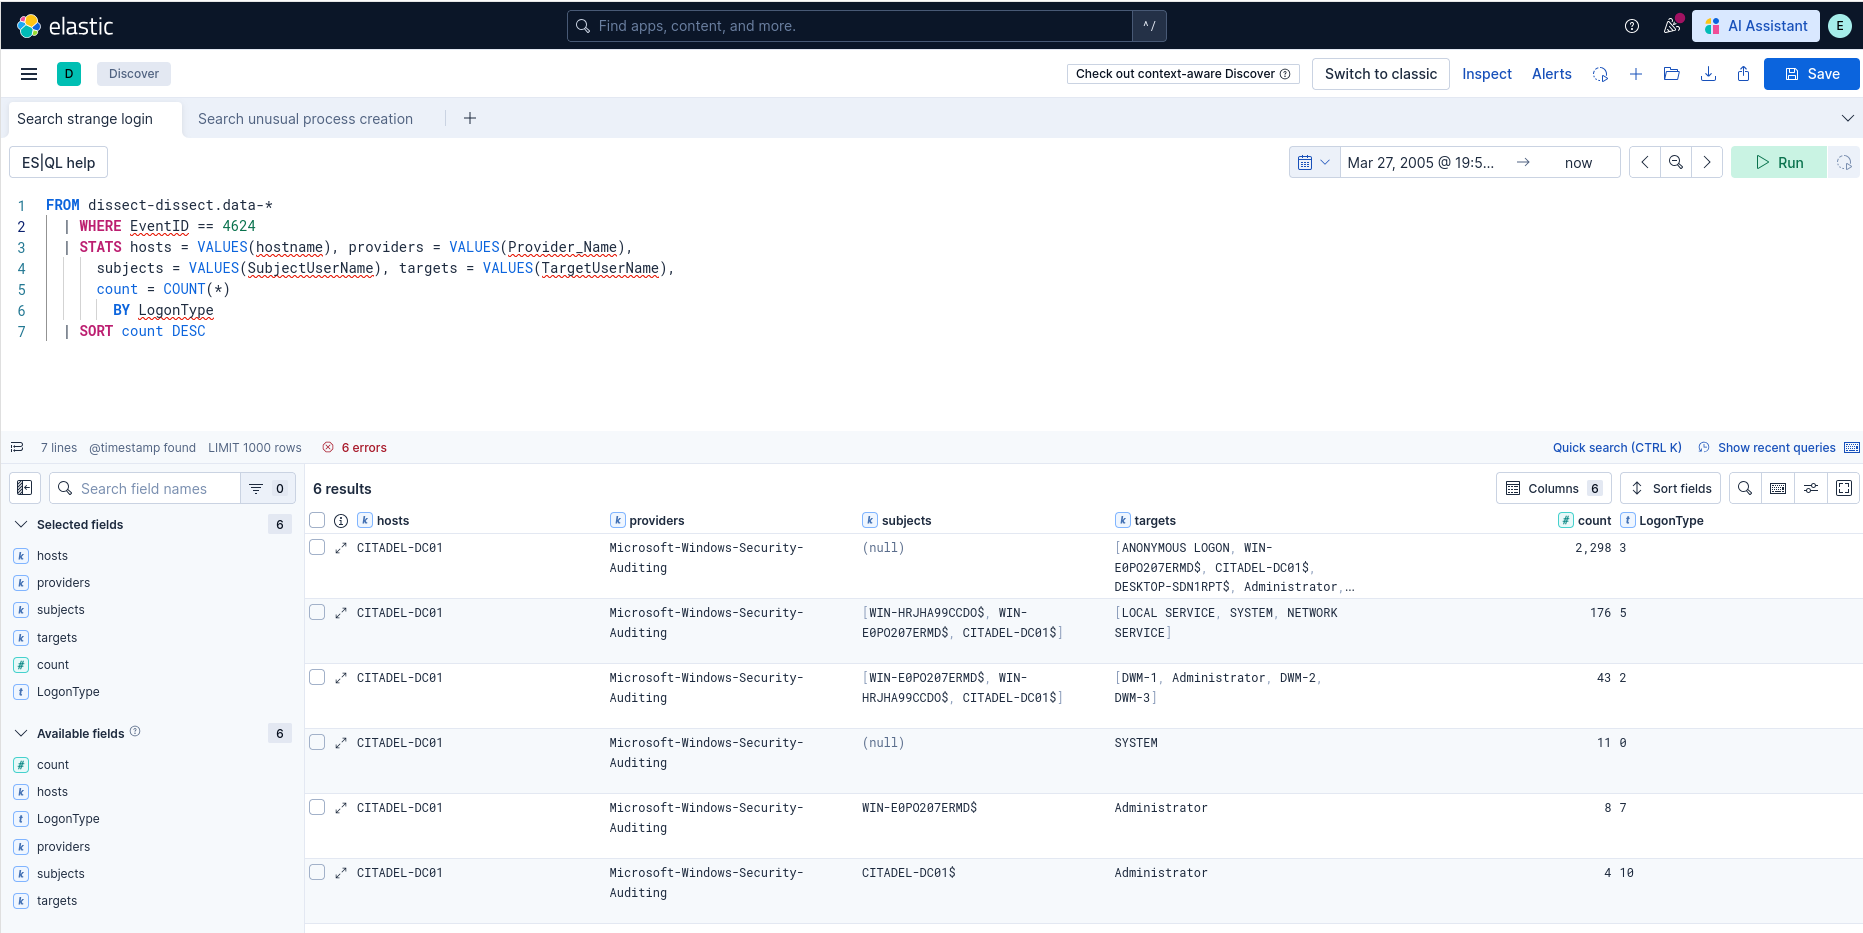
This query counts successful logon events (event ID 4624) across all machines in our dataset, grouped by logon type.
Indexing Additional Data
We have seen how to extract evtx files, but Dissect supports many other artefact types. You can list what is available for a given evidence file with:
target-query E01-DC01/20200918_0347_CDrive.E01 -l
Some useful examples: browser for browser history and cookies, ntfs for all NTFS records and the USN journal, ad for Active Directory computers, users and GPOs, shimcache, recyclebin, services, and tasks.
Multiple functions can be combined with a comma. However, Dissect does not provide a native way to tag an event with the function that extracted it. This is important for knowing where data comes from: event logs, registry keys, or elsewhere.
The only solution I found is a shell loop. For example, to index all persistence mechanisms:
for func in runkeys services tasks appinit commandprocautorun alternateshell bootshell sessionmanager filerenameop; do
  target-query E01-DC01/20200918_0347_CDrive.E01 \
    -f "$func" \
    | rdump \
        -J \
        --record-classification "$func" \
        -X _version \
    | nc -N localhost 50000
done
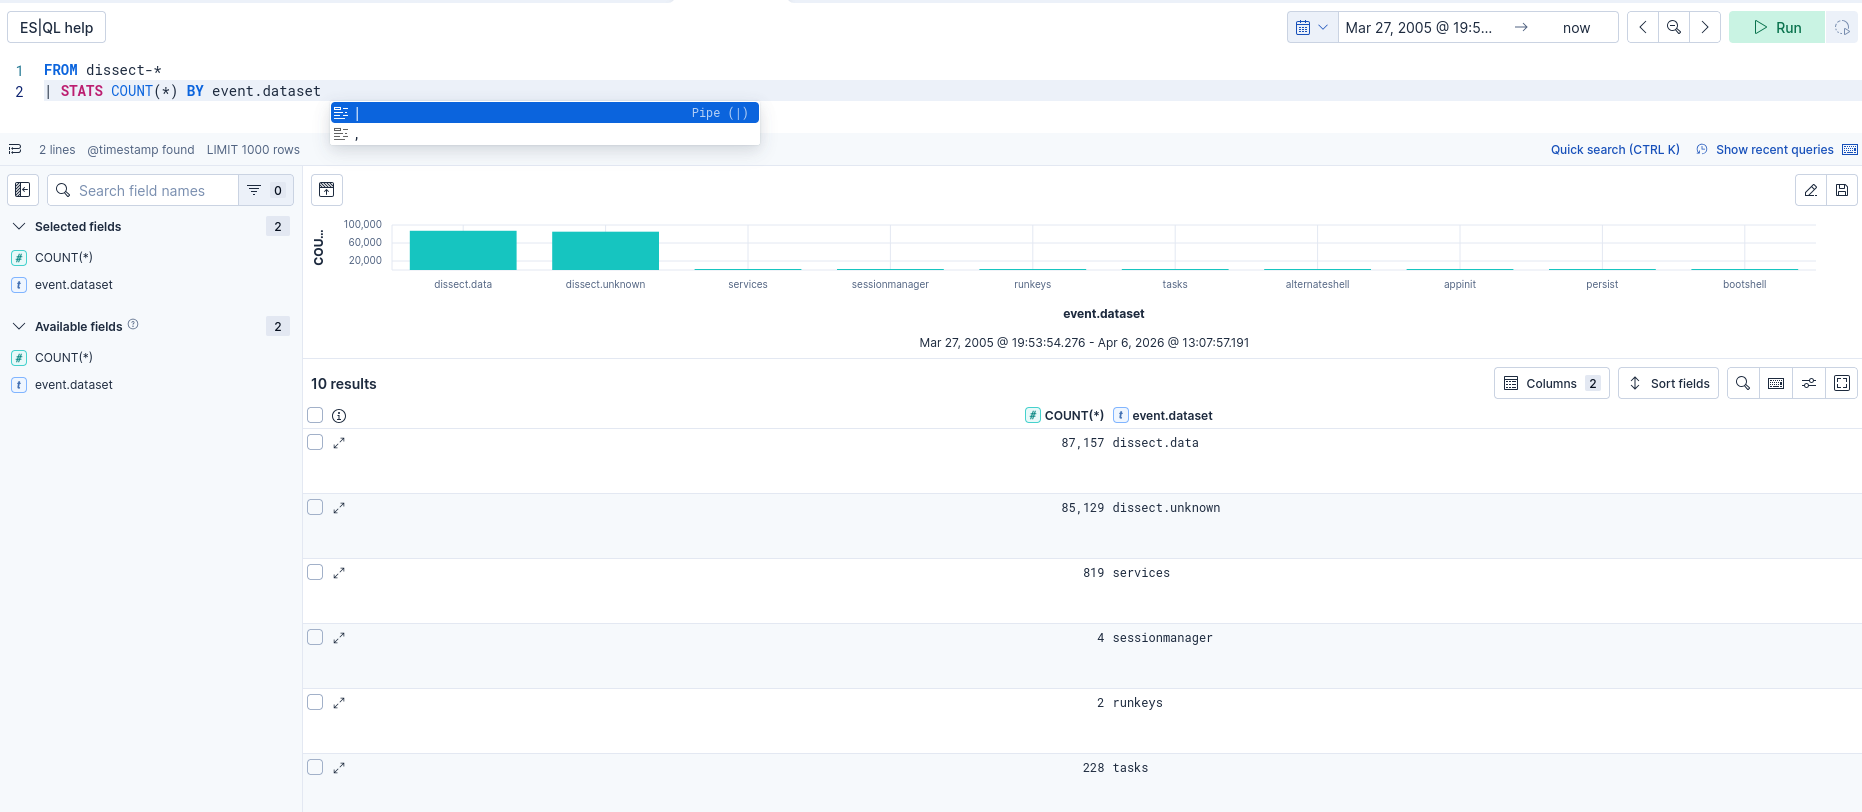
You can then list all your data sources in ELK with:
FROM dissect-* | STATS COUNT(*) BY event.dataset
Automatic Source Field
Dissect automatically populates the _source field with the path of the file from which each record was extracted. For system logs, event.module will contain for example C:\Windows\system32\winevt\logs\System.evtx. This lets you filter by source file directly in Kibana.
Pausing and Resuming ELK
To pause the ELK instance, run the following command from the docker-elk directory:
docker compose down
To restart ELK and recover your data:
docker compose up -d
To permanently delete all data, add the
-vflag when stopping:docker compose down -v
Conclusion
In this article we have seen how to use Dissect and ELK to search forensic data across multiple evidence files at scale. I hope you found it useful, see you next time!